
When appraisers develop opinions of market value, a cornerstone of credibility is how adjustments are derived. While paired sales analysis remains a favored technique, the practical challenge often lies in finding truly comparable pairs with only one varying feature. This is where grouped data analysis becomes a powerful, defensible alternative.
What Is Grouped Data Analysis?
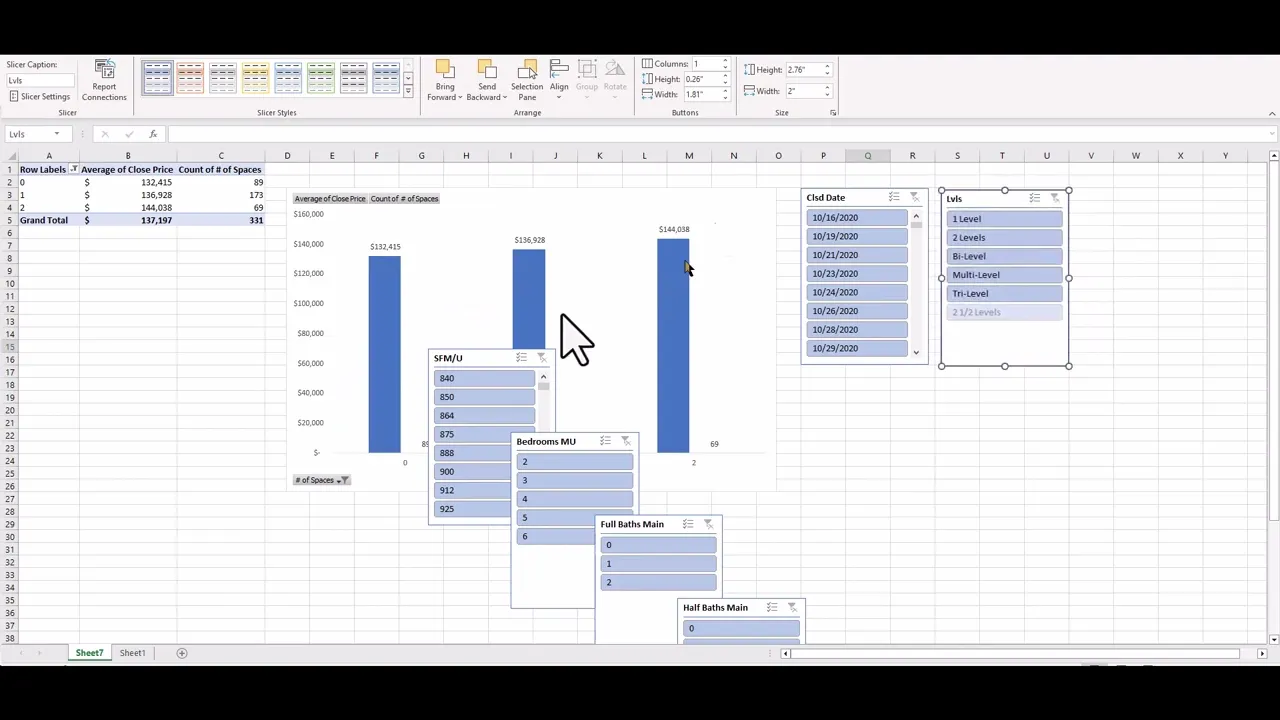
Grouped data analysis involves assembling market data into logical groups based on a single differing attribute, like the presence of a garage, an extra bathroom, quality differences or a specific view, and measuring how prices cluster within each group. Unlike paired sales, which rely on finding near-perfect matches, grouped data allows the appraiser to extract adjustment rates from multiple transactions by observing central tendencies, such as average or median sale prices.
For example, rather than searching endlessly for two identical homes where only the garage differs, an appraiser can:
Identify all recent sales with garages.
Identify all recent sales without garages.
Calculate the average or median sale price in each group.
Adjust for other known influences (e.g., location, square footage) as needed.
Observe the consistent price contribution of the garage itself.
This method aligns with principles emphasized in Valuation by Comparison, which highlights that “market-supported adjustments require logic, evidence, and defensible analysis - not simply rote application.”
Video: Watch Grouped Data Analysis in Action
If you’d like to see this technique illustrated step by step, watch our video walkthrough here:
When Should You Use Grouped Data Analysis?
Grouped data is especially useful when:
Paired sales are scarce or infeasible.
You need to demonstrate the market’s reaction to a property feature across multiple observations.
Lenders, clients, or reviewers require empirical support beyond anecdotal examples.
This technique can be applied to almost any quantifiable characteristic, such as:
Bathroom count
GLA (gross living area) increments
Lot size categories
Garage and parking configurations
Condition or quality ratings
Steps to Apply Grouped Data Analysis
Define the Attribute
Specify the feature you want to isolate.Segment the Market Data
Assign each comparable sale to the appropriate group.Normalize Other Influences
Adjust for secondary variables if needed to isolate the effect accurately.Summarize
Use averages, medians, or regression outputs to estimate contributory value.Reconcile
Cross-check your findings against other evidence, such as sensitivity analysis, regression models, or paired sales if available.
Advantages and Limitations
Advantages:
Utilizes more observations to strengthen credibility.
Reduces dependence on finding perfect pairs.
Provides a clear, documented rationale for adjustments.
Limitations:
Requires a sufficient sample size in each group.
Must carefully control for other variables to avoid distortions.
Demands thorough documentation to comply with USPAP standards.
Regulatory and Professional Considerations
According to the 2024–25 USPAP, adjustments must be supported by market data and logic, not solely by opinion. Grouped data analysis provides a systematic and transparent approach that meets this expectation.
Additionally, the Fannie Mae Selling Guide and the Freddie Mac Seller/Servicer Guide emphasize the importance of empirical evidence in developing adjustments, making this method particularly relevant for mortgage lending appraisals.
Final Thoughts
Grouped data analysis isn’t just an academic concept, it’s an essential tool for producing reliable, defensible residential appraisals in today’s market. By thoughtfully segmenting and analyzing comparable sales, appraisers can demonstrate the contributory value of property features with clarity and confidence.